Importance of ROIC Part 5: A Glance at the Last 42 Years of Wells Fargo
"Experience, however, indicates that the best business returns are usually achieved by companies that are doing something quite similar today to what they were doing five or ten years ago... a business that constantly encounters major change also encounters many chances for major error. Furthermore, economic terrain that is forever shifting violently is ground on which it is difficult to build a fortress-like business franchise. Such a franchise is usually the key to sustained high returns."
-Warren Buffett, 1992 Shareholder Letter
In the last post, I compared two hypothetical companies using some basic math regarding returns on capital. It helps to keep this general formula in mind, which is a rough estimate for how fast a business will compound intrinsic value over time... A business will compound value at a rate that approximates the following product: ROIC x Reinvestment Rate. To look at a real life simple example, let’s look at a company I’ve discussed before: Wells Fargo. Just for fun, I decided to check out the price in 1972, since I like looking at historical annual reports and I wanted to use a year where the stock market was in a bubble (and about to crash 50%). 42 years ago, the stock market was at the end of what is now known as the “Nifty-Fifty” bubble. It was a stock market where many large cap stocks were being bought at 40-50 times earnings or more by newly created mutual funds that were gathering assets at a feverish pace and were putting this inflow of cash to work at ever rising stock prices regardless of valuations. We know how this ended: by 1974 stocks had lost half their value, mutual funds went from uber-bullish at the top of the market to uber-bearish at the bottom, and valuations became much more reasonable. I wanted to use a year where stock prices were generally expensive to ensure that I wasn’t using data from a market bottom, and to also show that even in a bubble year, a business that subsequently continues to produce high returns on capital will create shareholder value.
High Returns on Incremental Investments Leads to Compounding Value
In 1972, Wells Fargo was trading at $0.59 per share (obviously, adjusted for splits). Today the stock trades around $52 per share, roughly 88 times the price it was in the 1972 market top. In other words, WFC has compounded its stock price at 11.4% annually, not including dividends. If we include dividends, shareholders have seen around 14% total annual returns over the past four+ decades. How did this happen? There are many reasons, but let’s just look at the math (i.e. the results of management’s execution, we’ll leave the “why” for another time). So to review this math, I pulled up an old annual report showing financial data from the early 70’s. The 1974 WFC annual report is the first one to provide market prices for the stock, as well as book value data. So I got 1972’s numbers from the ‘74 report. Here are some key numbers to look at from 1972 (again, I adjusted these for splits):
1972 WFC Book Value: $0.40
1972 WFC Stock Price: $0.59
1972 WFC ROE: 10.9%
1972 WFC P/B Ratio: 1.5
Let’s compare that to the numbers from halfway through 2014:
2014 WFC Book Value: $31.18
2014 WFC Stock Price: ~$52
2014 WFC ROE: 13.5%
2014 WFC P/B Ratio: 1.6
So in the past 41 and a half years, Wells Fargo has:
Compounded Book Value at 11.1%
Compounded Stock Price (not including dividends) at 11.4%
Earning power has compounded at 11.7% (earnings have grown from around $0.04 to over $4.00 per share)
P/B Ratio is roughly the same as it was 42 years ago
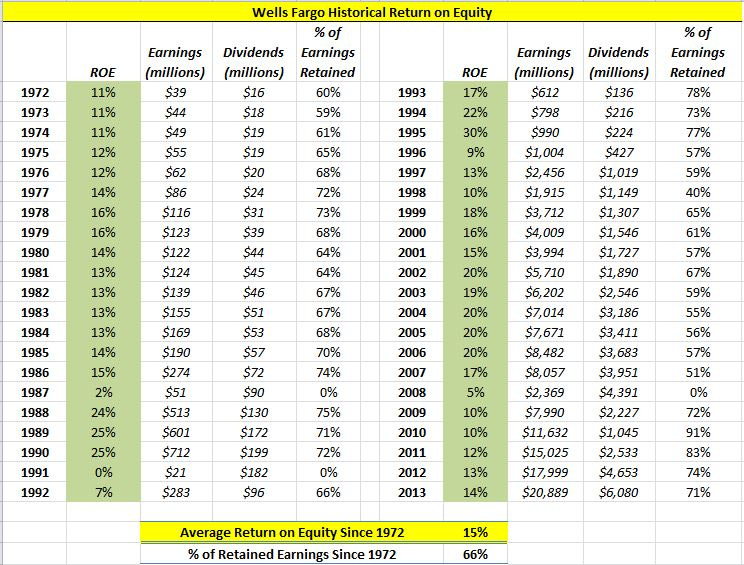
As you can see, the intrinsic value of the enterprise (as evidenced by the compounding net worth and earning power) has compounded very nicely over a long period of time, which has led to similar returns for shareholders. If we include dividends, shareholders have seen around 14% annual returns, even if they invested toward the top of the 1972 bubble. This year I spent a lot of time paging through many old Wells Fargo annual reports. If you look back over time, you’ll find that Wells Fargo produced mid-teen returns on its equity capital over the past four decades:

Some interesting things to note about the last 42 years:
Wells Fargo was profitable every single year (42 for 42)
Earnings increased from the previous year 35 out of 42 years
ROE averaged about 15%
And this isn't in the table above, but worth repeating:
WFC book value compounded at 11.1% since 1972
WFC stock price compounded at 11.4% since 1972 (not including dividends)
WFC earnings power compounded at 11.7% since 1972
You’ll also notice that in most years, it retained 2/3rd of its earnings and paid out the other 1/3rd in dividends. So I'm using some back of the envelope thinking here and simply saying that the reinvestment rate is the level of earnings Wells Fargo has to allocate after paying dividends (note: some of these earnings could be used for buybacks, acquisitions, etc...). Remember the back of the envelope math:
A business will compound at the product of two factors:
The percentage of earnings it can retain and reinvest
The rate of return it can achieve on that incremental investment
So it’s just the ROIC times the percentage of earnings it can reinvest (aka the reinvestment rate). In the example of Wells Fargo, I used equity capital (and thus, ROE), and the growth of book value as a proxy for the growth of intrinsic value.
By the way, you could also look at ROA, which might be a better way to compare core earning power of the bank. However, I wanted to look at ROE in this case since we are buying the equity when we buy the stock and we accept the given amount of leverage (ROE = ROA x Leverage).
Also, ROE averages over a long period of time (less dividends) is a good back of the envelope way to eyeball the growth in book value. And for a company like Wells Fargo, this long term compounding of net worth will approximately move in lock step with intrinsic value growth—and also stock price compounding… again, over a long period of time.
As an interesting side note, Wells Fargo carries less than half the leverage in 2014 than it did in 1972. In any event, we’ll compare the returns on equity capital to see how shareholder capital compounded over time.
So as you can see: 15% ROE and 66% Reinvestment Rate = 10% Intrinsic Value (Book Value) CAGR. You'll notice it's not exact, as book value compounded at 11%, and this back of the envelope math suggests book value will compound at 10%. The difference has to do with the aggregate effects of things like share buybacks/issuances, dividends, acquisitions, etc... but the basic idea should demonstrate that a business like Wells Fargo that can produce 15% returns on equity capital will grow the value of its net worth and earning power by 10% or so if it can reinvest 2/3rds of its earnings at that rate of return. Note: I went back to 1972 just for fun. You don’t need to wait 42 years. I also looked at the 1974, the 1984, and the 1994 numbers, which would have provided very similar results, thanks to the incredibly consistent returns on equity. Now, every time I post about a company with a long history of success, I get emails or comments about cherry picking, or the more sophisticated academic term: “confirmation bias” or “survivorship bias” (or something like that). The point here is not to say that WFC is a good investment now or a good company now just because it has done well in the past. The point is to simply look at the math...
High Returns on Incremental Investments Leads to Compounding Value
And the math tells you that if you can locate a company that is producing attractive returns on its incremental capital, and your analysis of the business tells you that it has enough reinvestment opportunities that it will continue to be able to produce those returns going forward, then you will likely have a company that will compound at an above average rate. Wells Fargo was able to compound value for shareholders over decades because they were able to consistently reinvest sizable portions of retained earnings at attractive returns on equity. Of course, this is just the math. The real work is handicapping each situation and being able to analyze and evaluate businesses. But the concept is important, and despite all that has been written about it, I think many people miss the concept, which puts them immediately behind in the count.
A Clue in Determining if a Business Can Continue Producing High Returns
You might ask: How does one determine if attractive returns in the past will lead to attractive returns in the future? One reason I inserted the Buffett quote from the 1987 shareholder report is that he provides a very valuable clue: It helps to locate a business that will likely be doing the same thing in 5-10 years that it’s doing now. In 2009, Blackberry was producing incredibly high returns on invested capital--around 40%. But the problem is that in 2014, Blackberry is a completely different business with different products than it was in 2009. And in 2009, it would have been very hard to predict what 2014 would look like for Blackberry. Similarly, Apple is producing incredible returns in 2014, and they have a great business. But I don't know what products Apple will be selling 10 years from now. My guess is that they will still have cool products and they will still be a great company, but it's hard to value a business when you don't know what they will be selling in 10 years. But it would have been fairly easy to predict in 2004 that Wells Fargo would likely be taking in low cost deposits and lending them out in 2014. They were doing this 5, 10, 20, 50, and 100 years ago. You wouldn’t have needed to know about the crash, the credit bubble, or the massive economic recession... just that the business you’re evaluating is durable and has survived various “real life stress tests” before, and that in 10 years, you’ll be able to close your eyes and picture what kind of business the company will be doing. Once you can reasonable predict what the company will be doing, then you can determine price, valuation, how much to pay, etc... We can discuss more on this in future posts… the point here is that it’s important to understand that a business that produces attractive returns on the capital it employs will produce value over time. Disclosure: John Huber owns warrants to buy Wells Fargo common stock for his own account and accounts he manages for clients. This is not a recommendation. Please conduct your own research. _____________________________________________________________________________ John Huber is the portfolio manager of Saber Capital Management, dressme.co.nz/ball-dresses.html">LLC, an investment firm that manages separate accounts for clients. Saber employs a value investing strategy with a primary goal of patiently compounding capital for the long-term. John also writes about investing at the blog Base Hit Investing, and can be reached at john@sabercapitalmgt.com.


