“Leaving the question of price aside, the best business to own is one that over an extended period can employ large amounts of incremental capital at very high rates of return.” – Warren Buffett, 1992 Shareholder Letter
Return on Capital Series
Importance of ROIC Part 5: A Glance at the Last 42 Years of Wells Fargo
Importance of ROIC: “Reinvestment” vs. “Legacy” Moats (a guest post that also captures the way I think about this concept as well)
I received a lot of feedback, comments and a few questions after Connor Leonard’s guest post last week. Connor’s write-up was very well articulated, and deservedly received much praise. There were a few questions which we tried to address in comments and email responses, but one comment that came up a few times was: how do you calculate the return on reinvested capital? I think a lot of people were looking for a specific formula that they could easily calculate. I think the concept that Connor laid out is what is most important. I think his examples did a nice job of demonstrating the power of the math behind the concept. His write-up also demonstrated why Buffett said those words in the 1992 shareholder letter that I quoted at the top of the post. So the concept here is what needs to be seared in. In terms of calculating the returns on capital, each business is different and has unique capex requirements, cash flow generating ability, reinvestment opportunities, advertising costs, R&D requirements, etc…
Different business models should be analyzed individually. But the main objective is this: identify a business that has ample opportunities to reinvest capital at a high rate of return going forward. This is the so-called compounding machine. It is a rare bird, but worth searching for. I amalgamated a few of my responses to comments and emails into some thoughts using an example or two. These are just general ways to think about the concept that Connor laid out in the previous post.
Return on “Incremental” Invested Capital
It's simple to calculate ROIC: some use earnings (or some measure of bottom line cash flow) divided by total debt and equity. Some, like Joel Greenblatt, want to know how much tangible capital a business uses, so they define ROIC as earnings (or sometimes pretax earnings before interest payments) divided by the working capital plus net fixed assets (which is basically the same as adding the debt and equity and subtracting out goodwill and intangible assets). Usually we'll want to subtract excess cash from the capital calculation as well, as we want to know how much capital a business actually needs to finance its operations. But however we precisely measure ROIC, it usually only tells us the rate of return the company is generating on capital that has already been invested (sometimes many years ago).
Obviously, a company that produces high returns on capital is a good business, but what we want to know is how much money the company can generate going forward on future capital investments. The first step in determining this is to look at the rate of return the company has generated on incremental investments recently. One very rough, back-of-the-envelope way to think about the return on incremental capital investments is to look at the amount of capital the business has added over a period of time, and compare that to the amount of the incremental growth of earnings.
Last year Walmart earned $14.7 billion of net income on roughly $111 billion debt and equity capital, or about a 13% return on capital. Not bad, but what do we really want to know if we were thinking about investing in Walmart? Let’s imagine we were looking at Walmart as a possible investment 10 years ago. At that point in time, we would have wanted to make three general conclusions (leaving valuation aside for a moment):
How much cash Walmart would produce going forward?
How much of it would we see in the form of dividends or buybacks?
Of the portion we didn’t receive, what rate of return would the company get by keeping it and reinvesting it?
Our estimates to these questions would help us determine what Walmart’s future earning power would look like. So let’s look and see how Walmart did in the last 10 years.
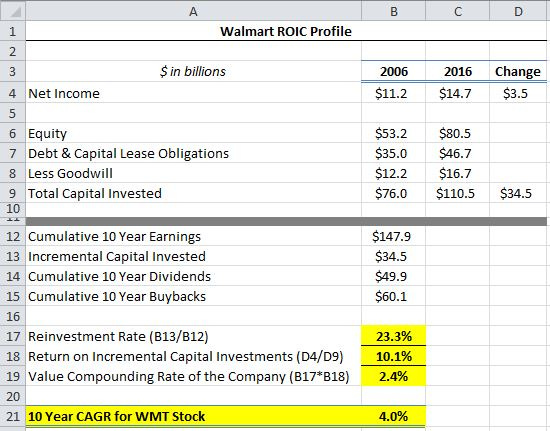
In 2006, Walmart earned $11.2 billion on roughly $76 billion of capital, or around 15%. In the subsequent 10 years, the company invested roughly $35 billion of additional debt and equity capital (Walmart’s total capital grew to $111 billion in 2016 from $76b in 2006). Using that incremental $35 billion they were able to grow earnings by about $3.5 billion (earnings grew from $11.2 billion in 2006 to around $14.7 billion in 2016).
So in the past 10 years, Walmart has seen a rather mediocre return of about 10% on the capital that it has invested during that time. Note: I’m simply defining total capital invested as the sum of the debt (including capitalized leases) and equity capital less the goodwill (so I’m estimating the tangible capital Walmart is operating with). I’ve previously referenced Joel Greenblatt’s book where he uses a different formula (working capital + net fixed assets), but this is just using a different route to arrive at the same basic figure for tangible capital. There are numerous ways to calculate both the numerator and denominator in the ROIC calculation, but for now, stay out of the weeds and just focus on the concept: how much cash can be generated from a given amount of capital that is invested in the business? That’s really what any business owner would want to know before making any decision to spend money.
Reinvestment Rate
We can also look at the last 10 years and see that Walmart has reinvested roughly 23% of its earnings back in the business (the balance has been primarily used for buybacks and dividends). How do I arrive at this estimate? I simply used the amount of incremental capital that Walmart has invested over the past 10 years ($35 billion) and divide it by the total earnings that Walmart has generated during that period (about $148 billion of cumulative earnings). An even quicker glance could simply be to look at the retained earnings on the balance sheet in 2016 ($90 billion) and compare it to the retained earnings Walmart had in 2006 ($49 billion), and arrive at a similar reinvestment rate: basically, Walmart is retaining roughly $0.25 of every $1 it earns and reinvesting it back into the business. The other $0.75 is being used for buybacks and dividends. As I've mentioned before, a company will see its intrinsic value will compound at a rate that roughly equals the product of its ROIC and its reinvestment rate (leaving aside capital allocation, which can increase or decrease value per share as well).
Intrinsic Value Compounding Rate = ROIC x Reinvestment Rate
There are other factors that can create higher earnings (pricing power is one big example), but this simple formula is helpful to keep in mind as a rough measure of a firm’s compounding ability. So if Walmart can retain 25% of its capital and reinvest that capital at a 10% return, we'd expect the value of the company to grow at a rate of around 2.5% per year (10% x 25%). Stockholders will likely see higher per-share returns than that because of dividends and buybacks, but the total value of the enterprise will likely compound at roughly that rate. And over time, the change in value of the stock price tends to mirror the change in value of the enterprise plus any value added from capital allocation decisions. Here is a table that summarizes the numbers I outlined above:
Not surprisingly, Walmart's stock price is only about 45% higher (not including dividends) than it was 10 years ago. So unless you are banking on an increase in P/E ratios, you're unlikely to achieve a great result buying a business that can only invest a quarter of its earnings at a 10% return.
Chipotle—A High Return on Capital Business
Let’s use the same principles to very briefly take a look at Chipotle, which is a business that has been able to reinvest its earnings at very high rates of returns over the past decade. For Chipotle, we’ll look at the last 9 years of operating results starting at the end of 2006, which was the first year that Chipotle operated as a standalone company (McDonald’s spun it off in mid-2006). Chipotle has great unit economics.
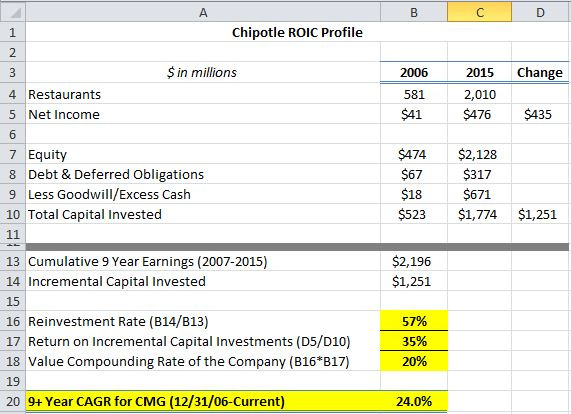
In 2015, it cost $805,000 to build out the average restaurant which, when up and running, produces around $2.4 million in revenue and better than 25% restaurant-level margins. So an $800k initial investment produces around $600k of yearly cash flow. In other words, the average Chipotle restaurant has achieved an incredible 75% cash on cash return (this is restaurant-level ROI before corporate G&A expenses and taxes). Over the past 9 years, Chipotle has grown from 581 restaurants to just over 2,000. They've invested a total of $1.25 billion to build out these restaurants which has increased its earnings by around $435 million. In other words, Chipotle saw around a 35% after-tax return on the capital it reinvested back into the business:
Chipotle was able to invest over half of its earnings at 35% returns, and using the formula described above to approximate intrinsic value growth, 57% reinvestment rate times 35% returns equals about a 20% increase in earning power. The result is that the stock price has compounded at over 20% annually, very much in line with Chipotle’s intrinsic value.
Mature Businesses vs. Compounders as Investments
Of course, the hard part is finding these companies in advance. Also, we should remember that buying cheap and selling dear is a very good strategy, and there are plenty of opportunities in the market to do so with durable and established, but low-growth businesses. Peter Lynch called these companies stalwarts—they were big companies without a lot of growth potential, but occasionally you could buy them at a discount and sell them after a 30-50% rise (which largely comes from the valuation multiple increasing as opposed to the business value increasing).
That’s a good strategy, and there are probably more opportunities that Mr. Market offers in this particular category. But an investor should realize that these investments are not going to result in big compounding results. Lynch’s famous 10-baggers came from the rare companies that could retain their earnings and plow them back into the business at high rates of return for many years. The former is much more common and actionable, but it’s still worth hunting for stocks in the latter category in my opinion. You only need a few to make a career.
To Sum It Up
What you really want to know is this: At the end of the year, the company will have made a certain amount of money. Out of that pile of cash, you want to know:
How much can the company reinvest into the business?, and,
What the return will be on that investment?
If Walmart makes $16 billion, they might spend $4 billion on building out new stores. How much additional cash flow will come from that $4 billion investment? Obviously, Walmart getting a 10% return on a quarter of its earnings is not nearly as attractive as Chipotle getting a 35% return on half of its earnings. The latter is going to create much more value than the former. This is a really rough measure of how to think about return on capital, but it’s generally how I think about it. Of course, there are different ways to measure returns (you might use operating income, net income, free cash flow, etc...) and there are many ways to measure the capital that is employed.
There are also “investments” that don’t always get categorized as capital investments but run through the income statement—things like advertising expenses or research and development (R&D) costs. To be accurate, you’d want to know what portion of advertising is needed to maintain current earning power (akin to “maintenance capex”). The portion above that number would be similar to “growth capex”, which could be included when thinking about return on capital. R&D could be thought of the same way. But hopefully this is a helpful example from a very general point of view on how to think about the concept. As a business owner, you want to know where you can reinvest your company’s excess cash flow and what rate of return you can get from those investments. The answers to those two main categories will in part determine how fast your business grows its earning power and increases its value.
John Huber is the founder of Saber Capital Management, LLC. Saber is the general partner and manager of an investment fund modeled after the original Buffett partnerships. Saber’s strategy is to make very carefully selected investments in undervalued stocks of great businesses.
John can be reached at john@sabercapitalmgt.com.


